Performance alerts from GraphOS
Receive notifications whenever metrics exceed defined thresholds
ⓘ NOTE
This feature is only available with a paid plan.
This feature is currently experimental. Your questions and feedback are highly valued—don't hesitate to get in touch with your Apollo contact or on the official Apollo GraphQL Discord.
GraphOS can notify your team's Slack workspace or Pagerduty instance whenever a particular metric (such as error rate) for a particular GraphQL operation exceeds a defined threshold. This is useful for detecting anomalies, especially following a release.

Supported metrics
You can configure performance alerts to trigger for any of the following metrics:
- Request rate: requests per minute
- Request duration: p50/p95/p99 service time
- Error rate: errors per minute
- Error percentage: the number of requests with errors, divided by total requests
Each performance alert you define can apply to either a specific operation or any operation. If you define an alert that applies to a specific operation, the "any operation" alerts for the same metric no longer apply to that operation (i.e., the more specific alert takes precedence).
Setup
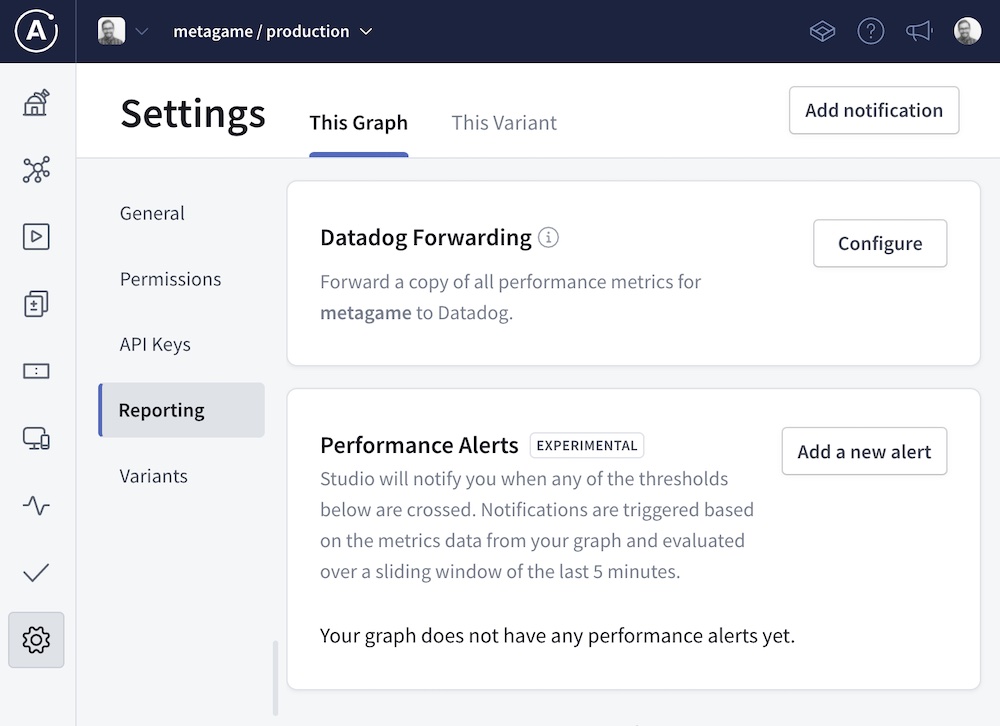
- Go to your graph's Settings page in GraphOS Studio.
- Select the Reporting tab.
- Find the Performance Alerts card and click Add a new alert.

- Configure the alert's Operation Name, Trigger, and Trigger Value to suit your needs.
- Select a Channel to send alerts to. You can select New Channel from the dropdown if you haven't yet configured the Slack channel or Pagerduty instance you want to use.
- Click Create.
Threshold window
Thresholds are measured against a rolling five-minute window. For example, let's say you configure an alert to trigger when an operation's error rate exceeds 5%. If 6 out of 100 executions of that operation result in an error during a five-minute period, the alert will trigger with an error rate of 6%. When the error rate falls back below 5%, your notification will resolve.